 ← Back to Blog
 What a DEXA Scan Actually Tells You (and What to Do With the Results)

What a DEXA scan actually tells you (and what to do with the results)
You step on your bathroom scale every morning and get a single number. That number tells you how much gravitational force the earth is exerting on your body. It tells you nothing about what your body is made of, where your fat is stored, whether you’re losing muscle, or how dense your bones are.
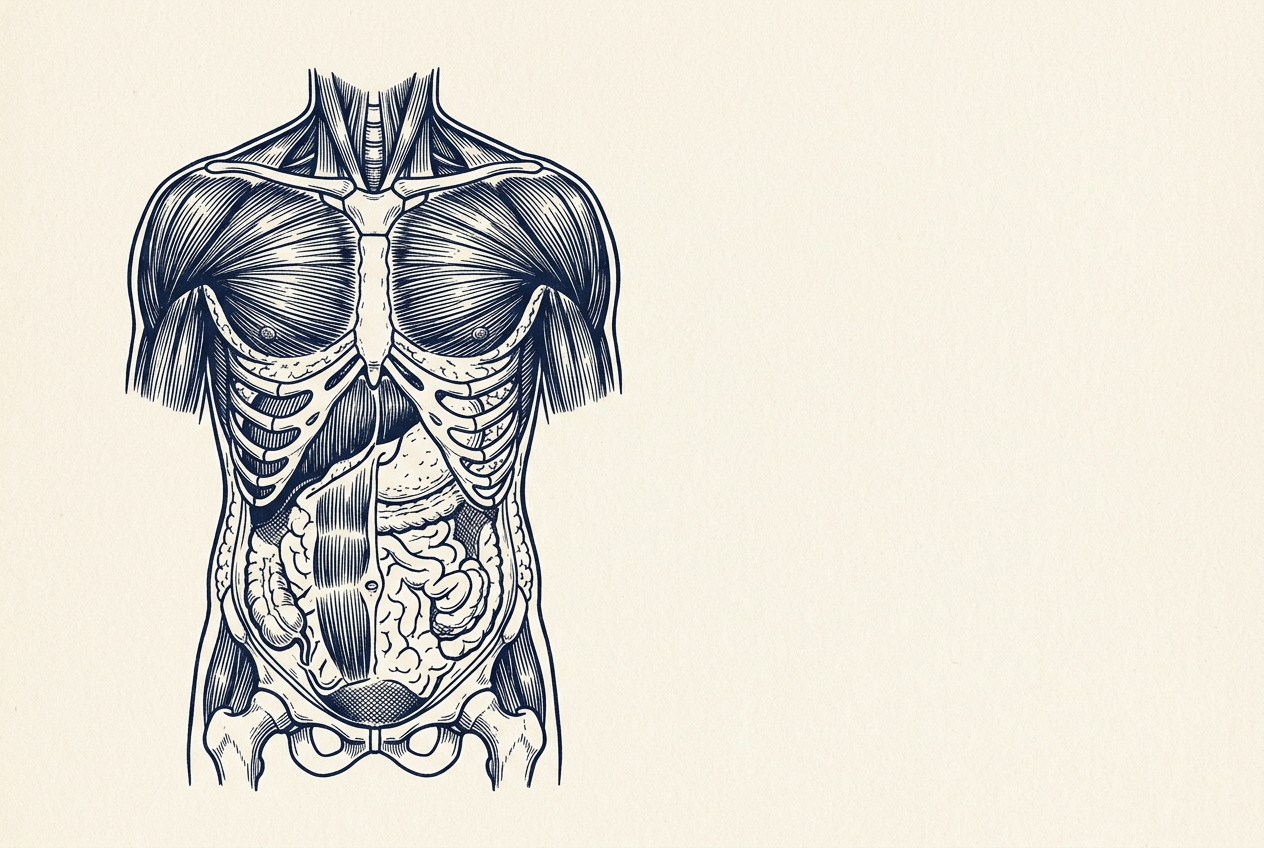
A DEXA scan (dual-energy X-ray absorptiometry) answers all four. It separates your body into lean mass, fat mass, and bone mineral content, maps each to specific regions, and gives you a report with a dozen or more data points. A scale, a mirror, or a BMI calculation can’t get close.
What DEXA measures (and why each metric matters)
The report breaks your body into regions: arms, legs, trunk, android (waist), and gynoid (hips). Here are the numbers worth paying attention to.
ASMI: the headline number
ASMI stands for Appendicular Skeletal Muscle Mass Index. You calculate it by adding the lean mass of your arms and legs (your appendicular lean mass), then dividing by your height in meters squared.
ASMI = (arm lean mass + leg lean mass) / height(m)^2
This is the headline metric in Protocol’s Muscle & Body Composition protocol because it predicts functional capacity, metabolic health, and fall risk more reliably than total body weight, BMI, or body fat percentage.
A healthy ASMI depends on your age and sex. For adults under 50, Protocol uses NHANES age/sex-matched norms: an ASMI below the 25th percentile for your demographic gets classified as “low muscle mass for age” and triggers a more aggressive protein prescription and closer monitoring. For adults 50 and over, the EWGSOP2 sarcopenia screening algorithm applies (more on that below).
Your ASMI is the number to track year over year. It tells you whether you’re building muscle, maintaining it, or losing it, independent of whatever is happening with fat or water.
Visceral adipose tissue (VAT)
Subcutaneous fat, the fat under your skin that you can pinch, is relatively inert. Visceral fat is different. It’s packed around your organs inside the abdominal cavity, metabolically active, inflammatory, and strongly associated with insulin resistance, cardiovascular disease, and type 2 diabetes.
DEXA quantifies your visceral adipose tissue in square centimeters.
| VAT (cm2) | Risk Level |
|---|---|
| Below 100 | Low metabolic risk |
| 100 - 160 | Moderate, warrants monitoring |
| Above 160 | High, associated with insulin resistance and elevated cardiovascular risk |
A person with a “normal” BMI can have a VAT above 160. A person with an “overweight” BMI can have a VAT below 100. The scale and BMI don’t distinguish between these two people. DEXA does. If your VAT is above 100, Protocol flags it for cross-referencing with your metabolic markers (particularly fasting insulin, HOMA-IR, and triglycerides) because high VAT and insulin resistance travel together far more often than not.
Bone mineral density (BMD)
DEXA was originally developed to measure bone density, and it remains the gold standard for that purpose. Your report includes T-scores for the lumbar spine, femoral neck, and total hip.
| T-score | Classification |
|---|---|
| Above -1.0 | Normal |
| -1.0 to -2.5 | Osteopenia (low bone density) |
| Below -2.5 | Osteoporosis |
Bone density peaks in your late 20s and declines from there. The rate of decline accelerates in women after menopause and in men after 60. Most people don’t know their bone density until they fracture something, which is the worst possible time to find out.
If your T-score is in the osteopenia range, the interventions are well-supported: vitamin D (2,000-4,000 IU/day, targeting serum levels of 40-60 ng/mL), calcium supplementation if dietary intake is below 1,000 mg/day, vitamin K2 (100-200 mcg/day MK-7), and resistance training with impact loading (jumping, bounding, heavy lifting). These slow or halt the decline. If your T-score drops below -2.5, that’s a physician referral for medical management.
Android/gynoid ratio
Your android region is your waist. Your gynoid region is your hips. The android/gynoid fat ratio tells you where your body preferentially stores fat.
A higher ratio (more fat in the waist region) is associated with greater metabolic risk: more visceral fat, higher inflammatory markers, greater insulin resistance. A lower ratio (more fat in the hip region) carries lower metabolic risk.
This metric is most useful for tracking changes over time. If your total body fat percentage drops but your android/gynoid ratio stays the same, you’re losing fat proportionally. If your android/gynoid ratio drops while total fat stays stable, you’re redistributing fat away from the metabolically dangerous location. That’s a meaningful win even without scale movement.
Regional lean mass and limb asymmetry
DEXA breaks lean mass down by region: left arm, right arm, left leg, right leg, trunk. This reveals two things.
Total distribution: Where is your muscle? Some people carry disproportionate lean mass in their upper body versus lower body, or vice versa. This informs training priorities.
Asymmetry: A large difference between left and right limbs (more than 10-15%) may indicate a compensation pattern, a past injury, or a training imbalance. If your left leg has meaningfully less lean mass than your right, your training program should address that, for both performance and injury prevention.
How to read a DEXA report
When you get your DEXA results, focus on five numbers in this order:
- ASMI: your muscle mass index. Is it above the 25th percentile for your age and sex? If not, that’s the priority.
- VAT: your visceral fat. Is it below 100 cm2? If not, cross-reference with metabolic markers.
- BMD T-scores: lumbar spine and femoral neck. Are they above -1.0? If not, start the bone health protocol.
- Android/gynoid ratio: which direction is it trending?
- Total body fat %: useful for context but less actionable than the four above.
The common mistake is fixating on body fat percentage while ignoring ASMI. A person with 22% body fat and an ASMI at the 15th percentile has a bigger problem than a person with 28% body fat and an ASMI at the 60th percentile. Muscle mass is the organizing metric. Fat percentage is secondary.
For a deeper argument on why body composition matters more than weight, read Why Body Composition Matters More Than the Number on Your Scale.
Sarcopenia screening: what the EWGSOP2 algorithm looks for
Sarcopenia (age-related muscle loss combined with declining strength) is one of the strongest predictors of disability, falls, and loss of independence after age 65. The European Working Group on Sarcopenia in Older People (EWGSOP2) published a screening algorithm that Protocol uses for every member 50 and over.
The algorithm has three steps:
Step 1. Find cases via grip strength
- Men: below 27 kg = probable sarcopenia
- Women: below 16 kg = probable sarcopenia
Grip strength is measured with a Jamar dynamometer. Best of three attempts, dominant hand. Takes about 2 minutes.
Step 2. Confirm with DEXA ASMI
- Men: below 7.0 kg/m2 = confirmed sarcopenia
- Women: below 6.0 kg/m2 = confirmed sarcopenia
This is where the DEXA scan becomes clinical.
Step 3. Assess severity with gait speed
- Below 0.8 m/s on a 4-meter walk = severe sarcopenia
If you’re 52 and your grip strength is 24 kg and your ASMI is 6.8 kg/m2, that’s confirmed sarcopenia. The interventions are immediate and aggressive: protein at the ceiling of the evidence-based range (1.8-2.0 g/kg body weight per day, distributed across 3-4 meals with at least 2.5-3.0 g of leucine per meal), resistance training at least 2-3 times per week, creatine monohydrate at 3-5 g/day (the most extensively studied supplement for muscle mass and strength), and physician review to rule out hormonal or medical contributors.
For adults under 50, the EWGSOP2 algorithm doesn’t apply. Muscle mass still matters. Protocol uses NHANES age/sex-matched percentiles: an ASMI below the 25th percentile at any age gets classified as “low muscle mass for age” and triggers the same nutritional and training response.
How to standardize your DEXA
A DEXA scan is only as useful as its comparability to your last one. The conditions of the scan affect the results, sometimes quite a bit. Here’s how to get reliable, comparable data:
Same machine, same facility. Different DEXA manufacturers (Hologic, GE Lunar) use different calibration methods. A Hologic scan and a GE Lunar scan of the same person on the same day can produce different absolute numbers. Always use the same machine for longitudinal tracking.
Fasted. A large meal before a scan adds food weight that gets counted as either lean mass or fat mass depending on where it sits. Fast for at least 4 hours. Ideally, get scanned first thing in the morning.
Hydrated but bladder voided. Hydration status affects lean mass readings (lean mass includes water). Drink normally but void your bladder immediately before the scan. A full bladder adds measurable mass to your pelvic region.
Same time of day. Body water shifts throughout the day. Morning scans are most standardized and most reproducible.
Timing: Baseline + 12 months. DEXA has a precision error of 1-2% for total body composition and 1-3% for regional measurements. Changes must exceed these thresholds to be considered real. At 6-month intervals, you risk measuring noise. At 12-month intervals, true changes in lean mass and fat mass are large enough to distinguish from measurement error.
The exception: Protocol recommends an optional 6-month interim DEXA only for members with clinical flags (ASMI below the 25th percentile, confirmed sarcopenia, or a major intervention change like starting testosterone replacement). For everyone else, 12 months is the right cadence.
Smart scales and BIA
If you have a smart scale at home (Withings, Renpho, Garmin), it uses bioelectrical impedance analysis (BIA) to estimate body composition. BIA sends a small electrical current through your body and measures resistance. Since muscle conducts electricity better than fat, the resistance gives a rough estimate of body composition.
Rough is the right word. BIA absolute values are unreliable. They’re affected by hydration, glycogen stores, recent meals, time of day, and skin temperature. A single BIA reading can be off by 5-8% for body fat. Two readings 12 hours apart on the same person can differ by 3-4%.
What BIA can do is track trends. If you weigh yourself at the same time every morning (fasted, post-void, same scale), the 30-day rolling average gives you a directionally useful trendline. Weight going down while estimated lean mass holds steady? Good. Weight stable while estimated lean mass drops? That’s a flag worth investigating with a DEXA.
Use the smart scale for daily trends and DEXA for clinical decisions. A single BIA reading means almost nothing.
What your results should change
A scan is only useful if it changes what you do.
ASMI below the 25th percentile: Your protein prescription goes to the ceiling of the evidence-based range: 1.6-2.0 g/kg body weight per day depending on age, distributed across 3-4 meals with leucine-rich sources at each. Resistance training becomes a primary intervention. Creatine monohydrate at 3-5 g/day, the most extensively studied supplement for lean mass and strength. Recheck DEXA at 12 months with a clear target: maintain or gain lean mass.
VAT above 100 cm2: Cross-reference with metabolic markers. If fasting insulin is elevated or HOMA-IR is above 1.5, the metabolic protocol becomes a priority. Visceral fat and insulin resistance reinforce each other. Reducing one typically reduces the other.
BMD T-score in osteopenia range: Vitamin D, calcium, K2, resistance training, and impact loading. Well-supported interventions, highly effective at slowing bone density decline.
Everything looks good: Baseline established. Come back in 12 months and compare.
How Protocol uses DEXA
DEXA is the measurement backbone of the Muscle & Body Composition protocol. Every member gets a baseline scan at intake and a follow-up at 12 months. The first encounter is a 45-60 minute session with a registered dietitian who walks through every metric: ASMI percentile, VAT, BMD, regional lean mass, limb symmetry, android/gynoid ratio.
The DEXA data feeds directly into the protein prescription, a specific daily target in grams per kilogram of body weight, broken down per meal, with leucine thresholds and food sources tailored to the member’s preferences. It also feeds into the Physical Capacity protocol, where the exercise programming is calibrated to the member’s actual lean mass, not their body weight.
At 12 months, the comparison scan answers the question that matters: did the intervention work? Did lean mass increase, hold steady, or decline? Did VAT move in the right direction? Did BMD hold? If a compliant member (someone who hit their protein targets and training sessions) shows a decline in lean mass, that’s a clinical signal that triggers an escalation: hormonal assessment, thyroid panel, cortisol, and a search for underlying causes. We don’t tell them to try harder. We look for what else might be going on.
That’s the difference between getting a scan and getting value from one.
Ready to find out where you stand? Protocol’s Foundation Assessment measures what your annual physical misses (ApoB, HOMA-IR, DEXA body composition, VO2 max) and builds a specific action plan from the data.
Related Content
Muscle & Body Composition→